Key Points
Citation: Church, J. A., N. J. White, L. F. Konikow, C. M. Domingues, J. G. Cogley, E. Rignot, J. M. Gregory, M. R. van den Broeke, A. J. Monaghan, and I. Velicogna (2011), Revisiting the Earth’s sea-level and energy budgets from 1961 to 2008, Geophys. Res. Lett., 38, L18601, doi:10.1029/2011GL048794.
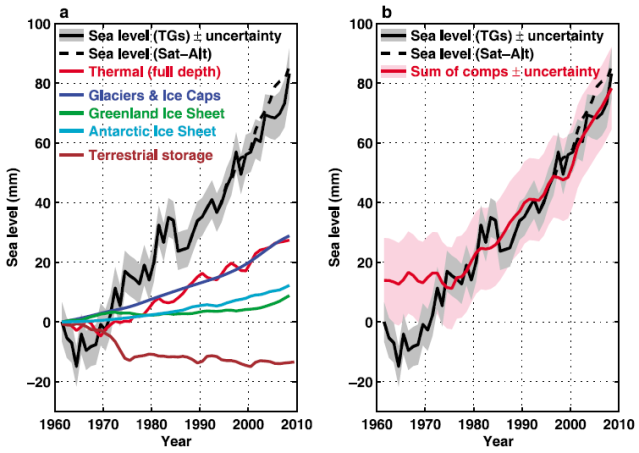
We review the sea-level and energy budgets together from 1961, using recent and updated estimates of all terms. From 1972 to 2008, the observed sea-level rise (1.8 ± 0.2 mm yr−1 from tide gauges alone and 2.1 ± 0.2 mm yr−1 from a combination of tide gauges and altimeter observations) agrees well with the sum of contributions (1.8 ± 0.4 mm yr−1) in magnitude and with both having similar increases in the rate of rise during the period.
The largest contributions come from ocean thermal expansion (0.8 mm yr−1) and the melting of glaciers and ice caps (0.7 mm yr−1), with Greenland and Antarctica contributing about 0.4 mm yr−1. The cryospheric contributions increase through the period (particularly in the 1990s) but the thermosteric contribution increases less rapidly.
We include an improved estimate of aquifer depletion (0.3 mm yr−1), partially offsetting the retention of water in dams and giving a total terrestrial storage contribution of −0.1 mm yr−1.
Ocean warming (90% of the total of the Earth’s energy increase) continues through to the end of the record, in agreement with continued greenhouse gas forcing.
The aerosol forcing, inferred as a residual in the atmospheric energy balance, is estimated as −0.8 ± 0.4 W m−2 for the 1980s and early 1990s. It increases in the late 1990s, as is required for consistency with little surface warming over the last decade. This increase is likely at least partially related to substantial increases in aerosol emissions from developing nations and moderate volcanic activity

Figure 2. The global sea‐level budget from 1961 to 2008. (a) The observed sea level using coastal and island tide gauges (solid black line with grey shading indicating the estimated uncertainty) and using TOPEX/Poseidon/Jason‐1&2 satellite altimeter data (dashed black line). The two estimates have been matched at the start of the altimeter record in 1993. Also shown are the various components as described in the text. (b) The observed sea level and the sum of components. The estimated uncertainties (consistent with Table 1) are indicated by the shading. The two time series are plotted such that they have the same average over 1972 to 2008.
More (Click here)

Editors’ Highlight
Revisiting sea level and energy budgets
Various factors contribute to sea level rise, including changing groundwater storage, thermal expansion of the oceans, and melting glaciers and ice sheets. However, studies that add up the observed contributions from these effects have not been able to account for the entire observed sea level rise over the past several decades. To help resolve the discrepancy, Church et al. (2011) revisited sea level budgets, considering sea level and Earth’s energy budgets together using new and updated estimates of all contributing factors for the past several decades, including a new estimate of groundwater depletion. They were able to close the sea level budget from 1972 to the present. They found that thermal expansion contributed about 40% of observed rise since 1972 and that the sum of glacier melting and thermal expansion explains about 75% of sea level rise since 1972. The remainder is from changes in ice sheets and terrestrial storage. Ocean heat content changes are also required to understand the Earth’s energy budget, which the authors also review. They found that about 90% of Earth’s energy increase in recent decades went to warming the oceans. Over the past decade, there was little surface warming, although greenhouse gases continued to rise, ocean heat content increased, and sea level rose. Increased sulfur emissions, especially from developing countries, as well as aerosol from volcanic eruptions, are inferred to have acted as a negative forcing, slightly offsetting the warming caused by greenhouse gases.
Published: 16 September 2011
Citation: Church, J. A., N. J. White, L. F. Konikow, C. M. Domingues, J. G. Cogley, E. Rignot, J. M. Gregory, M. R. van den Broeke, A. J. Monaghan, and I. Velicogna (2011), Revisiting the Earth’s sea-level and energy budgets from 1961 to 2008, Geophys. Res. Lett., 38, L18601, doi:10.1029/2011GL048794.